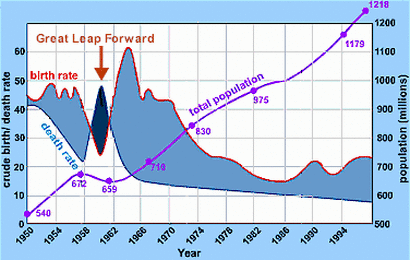
Birth and death rates
China currently has relatively unstable death and birth rates. but in the last few decades, you can definately see the decline in deaths and births in the demographic transition chart. What is of concern right now is that the country is now at a point where the death rate is rising and the birthrate is still falling. this means that the country is nearing stage 5 of demographic transition.
Demographic transition chart

For those who don't know, demographic transition charts indicate where the country is in the transition. There are five stages.
(google images)
- Stage one is where the birth rate and the death rate are extremely high.
- stage two is when the birth rate starts to drop
- stage three, the birth rate levels out and the death rate starts to drop
- stage four, the death rate and birth rate even out
- stage five, death rate is higher than the birthrate
(google images)
China Demographic Indicators 1990 1995 2005 2015 2025
Population:
Midyear population (in thousands) 1,148,364 1,216,378 1,297,765 1,361,513 1,394,639
Growth rate (percent) 1.4 1.0 0.5 0.4 0.0
Fertility:
Total fertility rate (births per woman) 2.2 1.8 1.5 1.6 1.6
Crude birth rate (per 1,000 population) 21 17 12 12 10
Births (in thousands) 24,219 20,849 15,249 16,406 13,444
Mortality:
Life expectancy at birth (years) 68 69 74 75 77
Infant mortality rate (per 1,000 births) 43 36 19 14 11
Under 5 mortality rate (per 1,000 births) 52 44 23 17 13
Crude death rate (per 1,000 population) 7 7 6 8 9
Deaths (in thousands) 8,211 8,308 8,072 10,320 12,398
Migration:
Net migration rate (per 1,000 population) -0 -0 -0 -0 -0
Net number of migrants (in thousands) -161 -219 -389 -436 -39
(U.S Census Bureau) did the chart and helped me with the interperated info down below.
In the above chart, we see that even though it is unsteady, the birthrate is declining and the death rate is rising. This means that China's population will begin to fall in a few years, should this pattern continue. also take notice of the lack of immigrants coming to the country. This coupled with the falling birth rate will leave a dramatic impact on China's population. Along with that, notice the midyear population is getting larger and larger, that would mean that soon, there will be a large population of older people and few younger people around.
